
While population growth (ie housing demand) has slowed, dwelling construction has increased to record highs. Over the 12 months to December 215, there was a record-high 190,072 dwellings constructed nationally.
With an increasing population, and the majority of growth coming from overseas migration, additional demand for housing is created. The charts published in this report look at the ratio of population growth to dwelling completions. A few important things to note from this analysis:
- The figures don’t take into consideration demolitions and homes constructed for non-permanent or semi-permanent occupation (previously estimated by the RBA at approximately 15%)
- Dwelling completions data may include construction of temporary accommodation such as hotels or serviced apartments
- An increase in population doesn’t necessarily create more demand for housing. For example a family having a baby may not create an immediate requirement for more housing while a new arrival from overseas is more likely to create additional housing demand.
The latest housing and occupancy costs research from the ABS showed that the average household sizes across each state and territory in June 2014 was: 2.6 persons in NSW, Vic, Qld and ACT, 2.4 persons in SA and Tas and 2.7 persons in WA and NT.
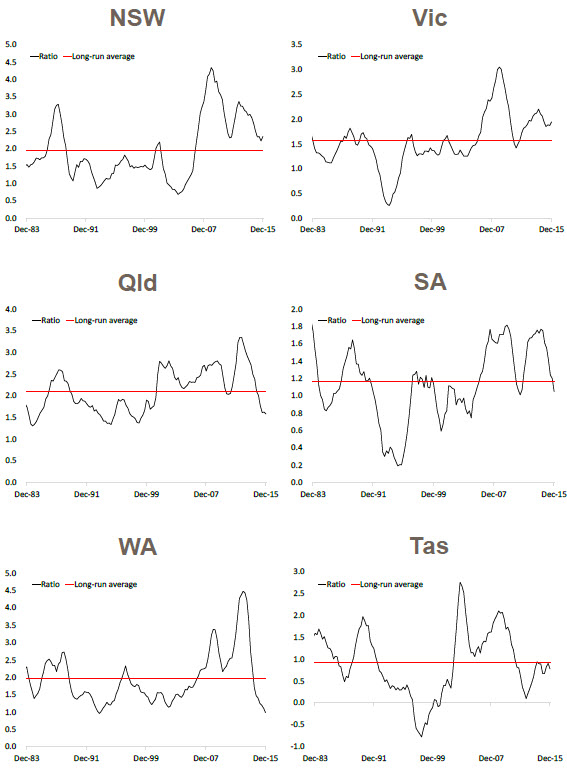
If we look at the charts, over 2015 the ratios of population growth to dwelling completions have been recorded at: 2.4 in NSW, 1.9 in Vic, 1.6 in Qld, 1.0 in both SA and WA, 0.8 in Tas, 0.4 in NT and 1.3 in ACT. Based on these measures compared to the average household size it would appear that each state and territory is currently over-building however, there are some short-comings of this analysis as detailed above. It is clear that the ratio compared to the long-run average implies that under-building is still taking place in NSW and Vic while over-building is occurring elsewhere.
Additionally, in most states, there has previously been a substantial undersupply of housing which will continue to overhang any overbuilding for a period of time.
Another thing to consider when looking at this analysis is the type of dwellings that are being constructed. Units are becoming a much more prominent part of dwelling construction. Units are often smaller and therefore likely to house fewer residents than a detached house which also has an impact on these figures.
Although this analysis doesn’t provide a definitive answer to whether too much construction is taking place it is clear that as population growth has slowed and dwelling construction has ramped-up there is now a much better relationship between housing supply and demand. This is highlighted by the fact that in most states and territories there has been a sharp decline in the ratio of population growth to dwelling completions over recent years.
With many new dwellings under construction and even more approved to commence construction, developers should take heed of these figures and exercise caution when looking to undertake new projects. As population growth trends lower and construction ramps up, housing shortages appear to be diminishing quite rapidly.


Leave A Comment